As of Friday January 8th, 2016 started off with the worst stock market returns (S&P 500) since 1923… and this week (down 2.5% today alone) is not much better so far.
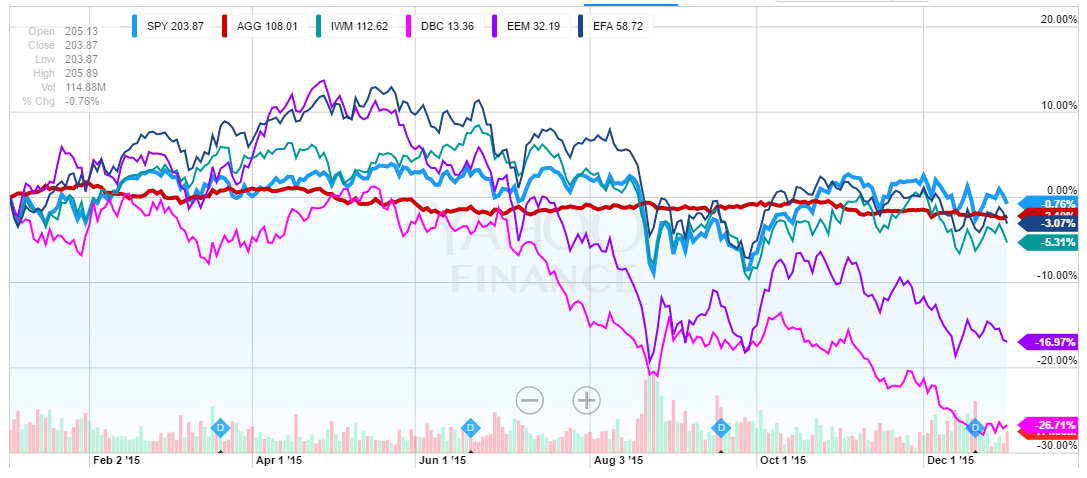
But lets review 2015. To do that, I made the chart below from Yahoo Finance. It goes from 1/01/2015 through 12/31/2015.
The market did not have it’s traditional Santa Claus rally at the end of this past year. The market dropped instead of it’s “usual” ending the year on a bright note.
But let’s keep in mind that even including the early good start to 2015, the market ended just about 10% off it’s record highs of May 2015 – so the world didn’t coming to an end.
Let’s look at the chart. What I think you will notice first though is the high degree of volatility in all of the asset classes except the bonds (AGG). I’ve included a chart of some of the major asset classes for the calendar year 2015 which shows how these each did.
The price of the S&P 500 index (LIGHT BLUE) lost just under 1% for the year. You can clearly see the volatility.
The Barclays Bond Index (RED) lost about -2.72%. This is a intermediate term blend of US Treasury’s and high-quality corporate bonds. Mostly just a slow grinding lower.
The Russell 2000 Index (US small companies in GREEN) lost over -5.3% for the year. To me, this was the biggest surprise since major factors for the S&P’s troubles were energy stocks and the stronger US dollar. Small companies are more immune from currency issues and should have benefited from the reduction in energy prices and low unemployment.
The Developed International stock index (EFA in DARK BLUE) lost about -3% for the year. There was a big divergence between indexes based on US dollars and those in the local currencies.
The Emerging Market Index (EEM -less developed countries like China, South Africa, Greece, India and Brazil) lost almost -17% (PURPLE) for the year. Most of these economies are tied to commodities which was a disaster this past year.
And the worst asset class on the chart was Commodities (DBC in PINK) which is made up of a large amount of energy ie: oil and gas) lost nearly -27% for the year. Oil wasn’t the only commodity dropping in 2015. Aluminum, copper, cotton and most food stuffs had terrible years too.
So in general, 2015 is a year that most professional advisors and their clients would like to forget!
Who knows where 2016 will go and how it will get there. Certainly there are going to be challenges like commodity prices, unwinding of QE (Quantitative Easing), receding corporate profits, geo-conflicts and rising interest rates in the US. But in my mind, perhaps the biggest risk to the global economy is the currency wars. Many central banks devaluing their currency to stimulate their local economies only to cause chain reactions across the globe.
Finally, I ask you to consider the 3 buckets of risk and are you comfortable with how your savings is allocated between those 3 buckets. If we have a big up year, can you live with the disappointment of losing out on some big gains if you have too much money in your safe and secure bucket?
Or would the pain of losing more than you’d like in a market crash keep you happy with your having whatever percentage in the safe and secure bucket that you deem right for your long-term plan… and help you sleep at night.
As you can expect, folks in my safe and secure buckets feel great right now – even if the market does turn around this year. They have no worries about the worst case.
For my clients with monies with my private wealth managers, 2015 was a difficult year (the markets went no-where as you see from the chart) but there was no clear trends for them to follow – which has been the way they’ve had many great years in the past. One or two of them got whip-sawed in 2015 – but that’s why I like to diversify among the dozen or so mangers. I cannot tell which will be the winners and losers in any particular year.
Right now, most of them are in cash (safe from the storm) and/or in bonds where for the moment, there is a “flight to safety”. A few are shorting the market which means they are profiting from the market drops so far this year.
My own main belief is there is more opportunity in avoiding the losses than trying to pick the winners. But in all cases, your investment portfolio should reflect your true tolerance for risk and more importantly be part of a written lifetime retirement income plan.
all the best… Mark