While I was up in Cincinnati last week to meet a few of our private wealth money managers (that I haven’t met yet), I saw this chart on the wall.
I asked for a copy of and so I could share it with you all (at the bottom of this post).
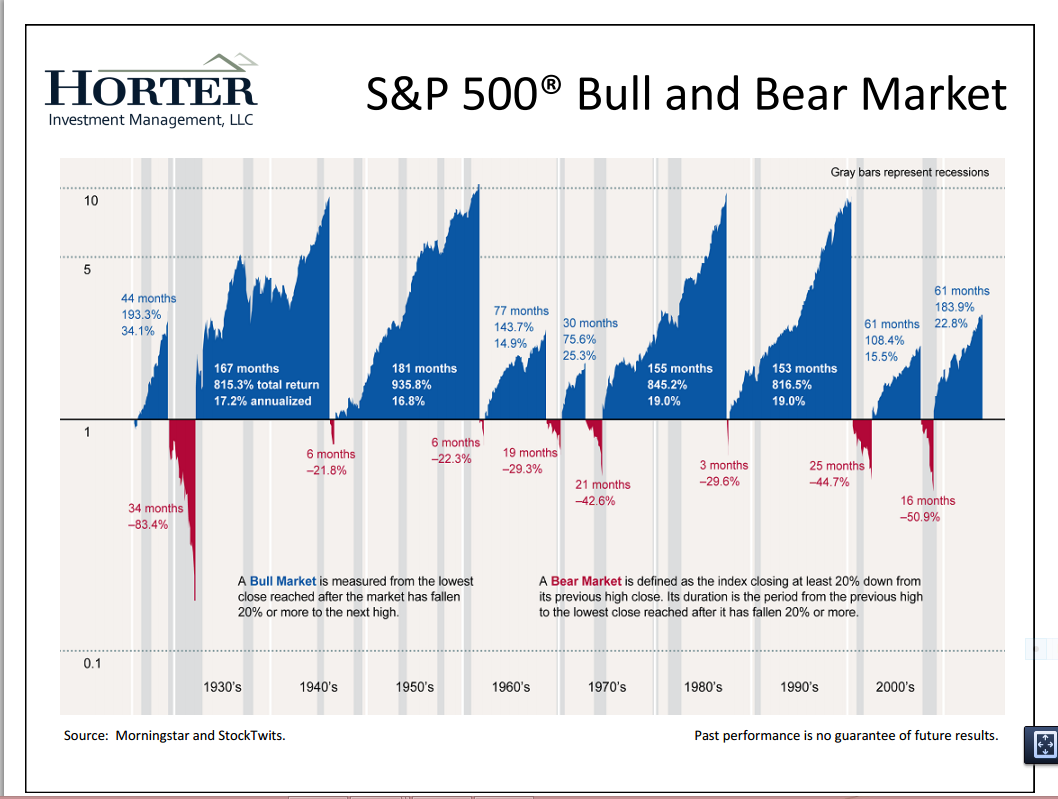
The chart shows each bull (BLUE) and bear (RED) market going back to the early 1900’s, the average annual gain (or loss) and the total gain during the bull market or total loss in the bear market.
You’ll see that most bull markets last over 100 months but some only lasted 30 months. Historically, bear markets have lasted 3-34 months. Except for the Great Depression (-83%), most draw downs (drop from peak to trough) were in the range of -29% to -50% losses.
It is interesting to note that most of the bear markets occur during recessions (shown in gray bars). However, there are times that the market has dropped (such as 1987) without a corresponding recession. A recession is defined as two or more negative GDP growth quarters in a row.
There were two other charts that we studied as well. One was margin debt (people borrowing money to buy stocks). It showed that every time margin debt reached a peak, stocks sold off not long after (in 2000 and 2008 for example).
Why? Because when stocks start to fall, these folks get “margin calls” which means they have to send their broker cash. Many folks have to sell stocks to raise that cash – which accelerates the market decline as more folks have to meet new margin calls. It’s a downward cycle that can take on a life of its own.
The other interesting chart, showed how the Federal Reserve’s buying bonds (QE1, QE2 and QE3) effected the S&P 500. As the Fed bought more bonds the stock market increased. When the Feds stopped buying bonds, the market went sideways or down.
Nobody can predict the next market correction or crash. Stocks can go higher. My last blog post was about bonds and the likely correction coming (at some point) when interest rates rise.
The Fed is no longer buying bonds, margin debt is at record levels and we are in the 7th year of positive market returns (never happened before). Who knows how much higher the market will go, but having tactical money managers on my side sure does alleviate a lot of my anxiety.
They can go to cash to protect capital and a few can even “short” the market to profit from the next crash. Other managers can even profit when interest rates start their rise to more normal levels. When one manager zigs, others zag as they have strategies that are not highly correlated.
Inside the lower risk and moderate risk buckets (the stock and bond markets) there is never a dull moment. But if we can greatly reduce the risks without compromising too much on the long-term potential returns, we can dramatically improve a retirement income plan.
all the best… Mark