“Accumulation vs. Distribution” is another part of the “Math vs. Money” concept.
One of the most difficult concepts I have to train my own clients to appreciate and fully understand is the fact that rates of return are not just meaningless when it comes to retirement income planning, they are misleading and can even be dangerous as well. You can also watch a short 5 minute video webinar about MATH vs. MONEY on the video page of this website.
It Can Be A Difficult Concept To Grasp
Here’s what I mean. Wall Street likes to brag about the high rates of return received by the market; specifically the S&P 500, over the past 40 years or so. And they have a right to brag about the index’s accumulation as the growth was pretty spectacular. In fact, if you had put just $100,000 in an index fund pegged to the S&P 500 in 1973, you would have almost $5.5 million today! That works out to just under a 12% average rate of return over that long period of time – despite the two big drops in 2000-2002 and 2008/2009 shown below. The chart right below shows the growth better than words.
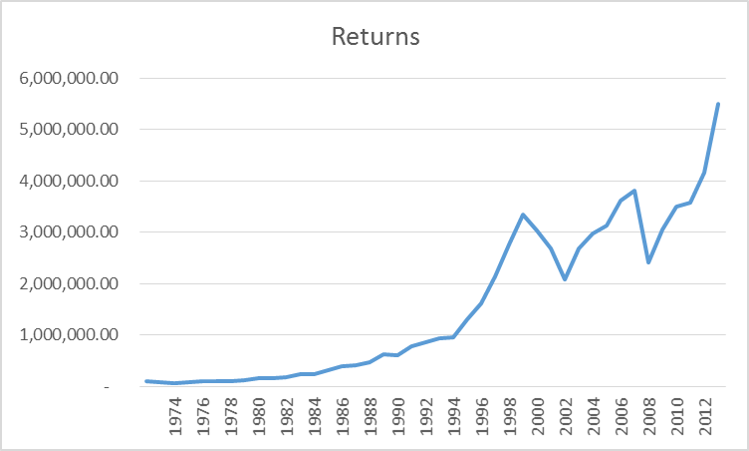
But the thing about all this is, is that the whole model completely falls apart once you start taking income. Here’s what I mean. Take the above chart…the exact same returns in the exact same order, and start deducting a $4,000 (the “4% Retirement Income Rule”) annual income from it, adding a 3% inflation factor. If one did that, the total amount of income withdrawn at the end of those 40 years, would be $366,430.
So a reasonable person would expect to have at the end of those 40 years, somewhere around $5 million left in the account, right? I mean, $5.5 million less $366,430 of total retirement income withdrawals, less the growth on those withdrawn funds would seem to leave around $5 million. For most folks, I think that would be a reasonable guess and one anyone might readily accept as within the ballpark. Wouldn’t you agree?
The problem is, the market doesn’t conform to any sort of logic or reason. It’s totally random and has huge swings in value – both UP and DOWN! The next chart shows what actually would have happened to your savings if you had taken 4% of $100,000 (adjusted for inflation) each year from your mutual funds.
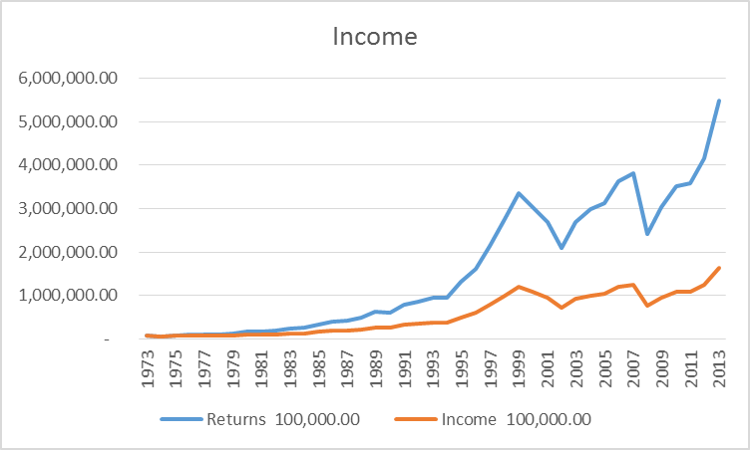
Now that orange line doesn’t look anywhere near $5 million, does it? In fact, it ends up at only $1,643,000! So the reality is that $366,000 in income taken over the 40 years would actually cost you almost 10 times that much in lost growth, or a bit under $3.4 million!
This just goes to show you the very real and substantial difference between accumulating assets (your saving phase) and taking withdrawals during retirement (the distribution phase). Investing should not be treated in the same way for accumulation and distribution. But that’s not how most people go about retirement income planning.
Taking income from volatile investments during a down market can be devastating to retirement success — (whether or not you outlive your money).
all the best… Mark