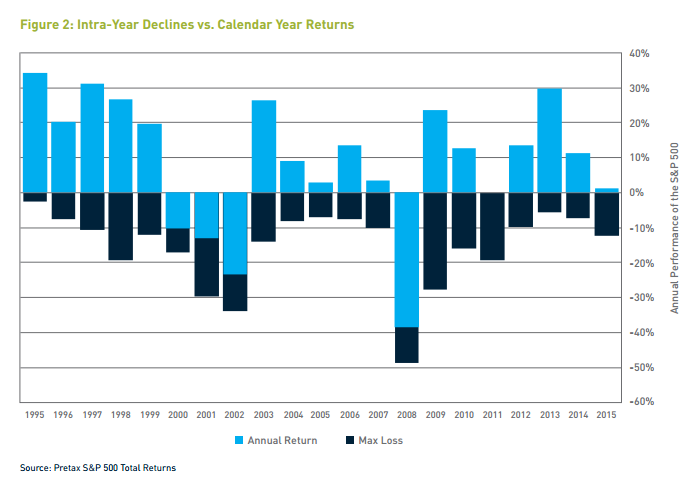
The chart I am highlighting this week shows a comparison between the calendar year’s gain (or loss) and the largest draw down (market loss) that occurred within the calendar year going back to 1995.
You might remember that draw down is the percentage amount of drop an investment has from it’s peak down to it’s trough. In other words, the intra-year maximum loss.
The LIGHT BLUE bars show the calendar year return. THE DARK BLUE bars show the intra-year declines (draw down percentage) of the S&P 500.
In each one of those 21 years, there was a draw down of anywhere between 2% and 47%. It during the up years there was always some draw down. That’s right, in every single year, even the ones with 30% gains – every single year
had some type of decline.
During the 4 negative calendar years (2000, 2001, 2002 and 2008) the size of the intra-year draw down within the calendar year was actually greater than the year-end loss.
In 10 of the years, the draw down was about 10% of more, with drops of over 25% in four years.
all the best… Mark