The following is an excerpt from Ben Carlson’s, CFA blog post on June 4, 2020. I really enjoy his writing and historical perspectives and wanted to pass it along to my readers.
“Once you start digging into the historical numbers you begin to realize the stock market is even crazier than advertised. Surprisingly, huge up and down moves happening in the same year is not that out of the ordinary.
The Great Depression crash which began at the tail end of 1929 and lasted well into the 1930s is by far the most insane stock market environment in history. I can’t even imagine what these moves must have felt like in real-time but here are some of the massive upswing and downswings that occurred in those years:
In 1929, the stock market was up 32% through the fall before peaking in September. It would then fall almost 45% over the next 2 months before rising an additional 28%. Stocks finished the year down 8.3%.
Over the first 4 months or so of 1930, the market rose 22%. The rally didn’t last as the next 8 months would see a 44% drawdown. Over the course of the year, the market was down 25%.
The first 2 months of 1931 saw stocks rise close to 19%. The ensuing losses had to be a back-breaker for investors as the stock market fell more than 57% from those levels into late-December. 1931 would turn out to be the worst year on record for the S&P 500, ending the year down 44%.
The encore performance to the worst year ever in the stock market was a 51% drop over the first 5 months of 1932. From there the market would have one of the most vicious rallies in history, rising an astonishing 112% over the next 3 months or so. While that would mark THE bottom in 1932, the market still fell another 31% before the year was up. After all that back and forth, stocks finished the year down just 8.6%.
The Great Depression crash technically occurred from late-1929 through mid-1932 but the selling didn’t subside completely in 1933 as stocks began the year falling another 25% in the first 2 months. From there the market would rise a staggering 121% through July before falling another 29%. Stocks were up close to 50% for the year after all of this volatility in one of the best years ever.
There were no triple-digit gains but even 1934 saw a gain of 21% in addition to a drawdown of 29%.
It wasn’t just the 1930s that saw such massive intra-year volatility.
In 1974, the market was down 37% before bottoming in early-October. Stocks would rally 21% over the next month. The year ended down 26%.
In 1980, stocks began the year falling 17% only to experience a 43% bounce thereafter. Stocks were up 32% on the year.
1982 saw a similar 17% drawdown coupled with a 40% jump. Year-end returns were more than 20%.
Before the Black Monday crash in 1987 saw stocks get dinged almost 34% in a week, the market had risen 40% through the end of the summer. Surprisingly, stocks finished that year up almost 6% even after the worst one-day crash in history.
The late-1990s bubble was a sight to behold as the S&P 500 rose by 20% or more for 5 straight years from 1995-1999.1 But 1998 also had a 19.3% drop before rising almost 34% and finishing out the year with a gain of 28%.
The remnants of the dot-com bubble bursting along with 9/11 created three wild price swings in the market in 2001. Following an up month in January, stocks would fall 19% before seeing a 19% rally which was followed by a 26% crash. Stocks ended the year down roughly 12%.
The Great Financial Crisis bottomed in early-March of 2009 but not before getting shellacked by nearly 28% from the start of that year. Stocks would go on to leap more than 67% for the remainder of the year, finishing 2009 with a total return of 26%.” End of quote from Ben Carlsen’s post.
So what’s next for the stock market? It’s anybody’s guess.
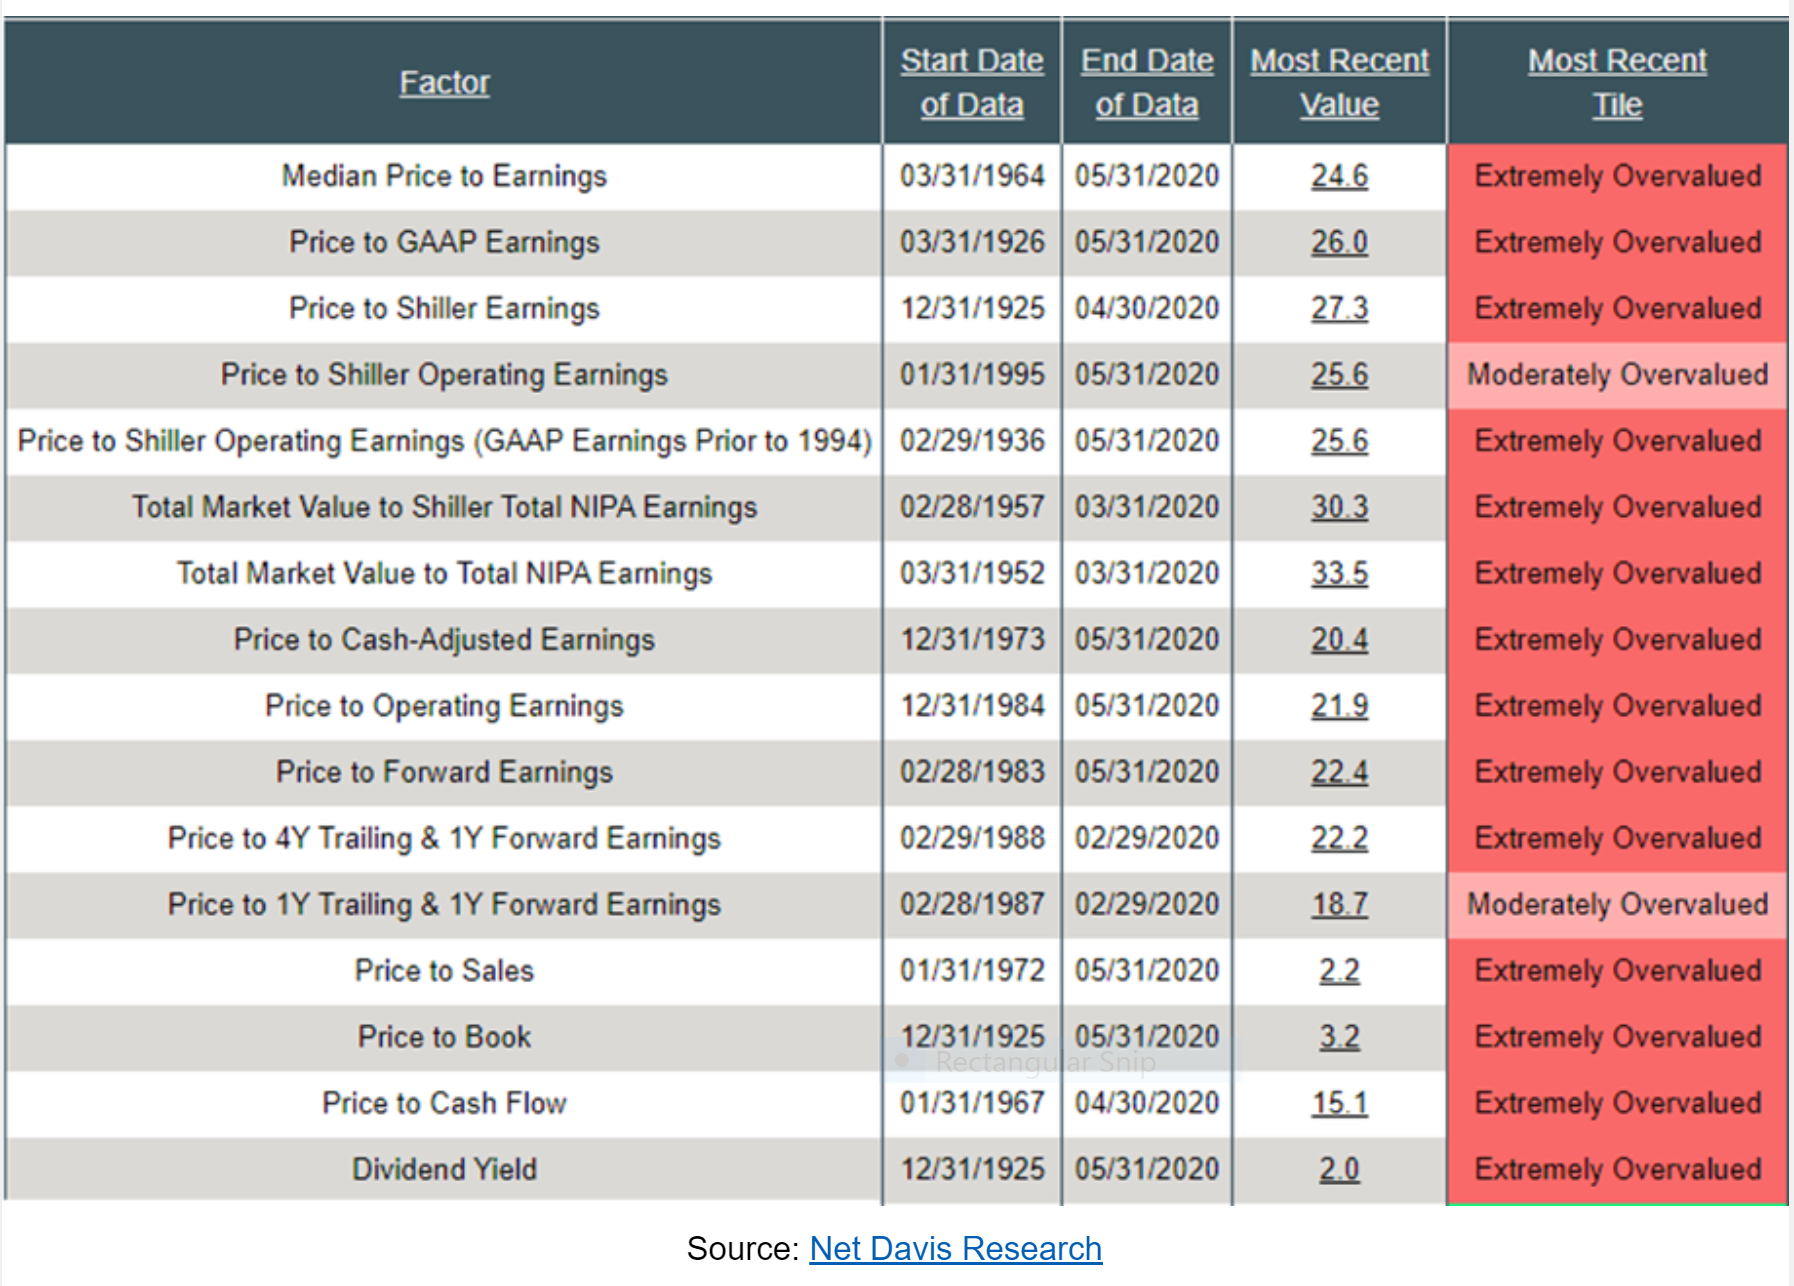
Most everyone has enjoyed the Market’s Rebound (at least watching it if not participating). However, today’s valuations are down-right alarming according to research by Ned Davis Research (not “Net” Davis as the image portrays). You can see the basis of their educated opinion in their chart below (but of course it’s still their opinion).
Personally, I’m not in any rush for jumping back in – although it would not surprise me if stocks went up by another 5% or so. But again, most of our own retirement savings are in the Principal Protected Bucket (fixed indexed annuity and indexed life insurance). So we’re sleeping pretty well no matter where the markets go next.
all the best… Mark