Wow – what a year 2020 has been so far. And we still have the elections to come! At various times this year the S&P 500 index has been down -30% and up +8% from where it was when 2019 ended. Right now it’s currently up about +7% YTD.
And the Nasdaq 100 has been even more volatile — down as much as -20% and up as much as +43%, and believe it or not has a +33% gain YTD.
The US Small Cap Index (Russell 2000) has been higher by as much as +2% this year, down as much as -40% and is basically at breakeven for the year.
Yes, the various US stock markets have been all over the place in 2020.
And while this year is an outlier in terms of the wild ups and downs, volatility is something that I believe every investor is going to have to contend with from now on. Investors must simply have to be willing to accept some form of volatility if you would like to earn anything on your savings. Volatility and downside risk have always been part of investing in the markets.
Warren Buffet has always said that if you can’t stand to see your portfolio drop by -50% – then you should not be invested in the stock market.
Below you’ll see a chart from JP Morgan that compares the biggest peak-to-trough drawdowns each year on the S&P 500 to the total return for that year. The gray bars are the positive and negative annual returns. The small negative numbers in red show the largest drop (within that calendar year) – even if the year ended with a positive gain.
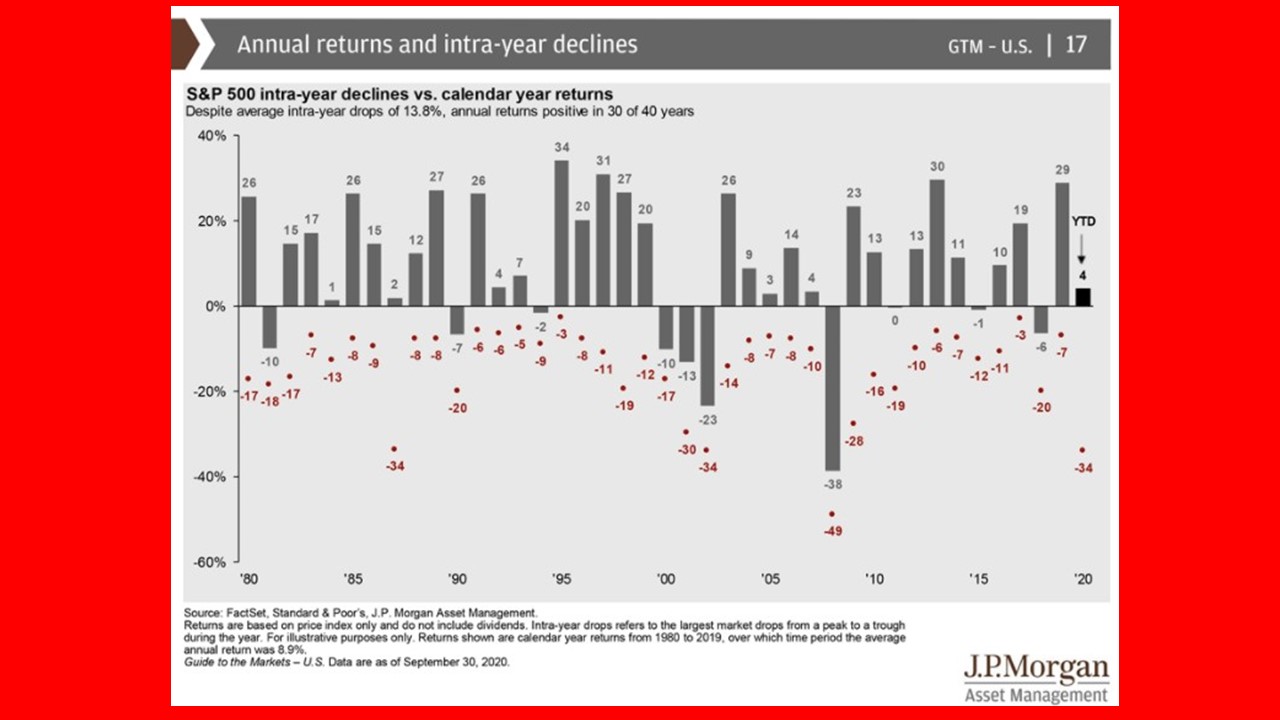
Wow – doesn’t 1987 look a lot like 2020?
Look at the drawdown this year. The S&P was down -34% peak-to-trough back in March yet now the market is up on the year. Please note that the S&P 500 is so heavily weighted to the biggest 10-15 stocks that are way up while about 50% of the 500 stocks are negative YTD – some by double-digit negatives.
In 23 out of the 41 years shown on the above chart, there has been a double-digit drawdown within the year. In 12 of those 23 years, the index actually finished the year in positive territory. And in 8 of those 23 years, the S&P 500 finished the year with double-digit gains.
I believe it’s a pretty good bet that these huge variances in stock returns between gains and losses in any given year will continue for a number of years.
Historically low-interest rates on bonds and CDs. etc are pushing people to take more risk to get returns that even match inflation. The Federal Reserve is more entrenched in the bond markets than at any time in history – even the great depression.
Millions of savors not only want, but need, to earn higher returns on their life savings just to keep up with low inflation (after-tax). Many retirees who don’t have enough money saved for retirement are without enough capital to cover their ongoing and future bills.
These factors (stock volatility and low-interest rates) could lead to some interesting portfolio allocations decisions in the years ahead. As I wrote in a previous blogpost – the “60/40 Portfolio is Dead”. Even the folks at major brokerage houses have finally caved in to this notion. But their response is to buy more stocks! Take more risk. Suffer more volatility.
Most of my clients don’t want more risk. They want more predictability!
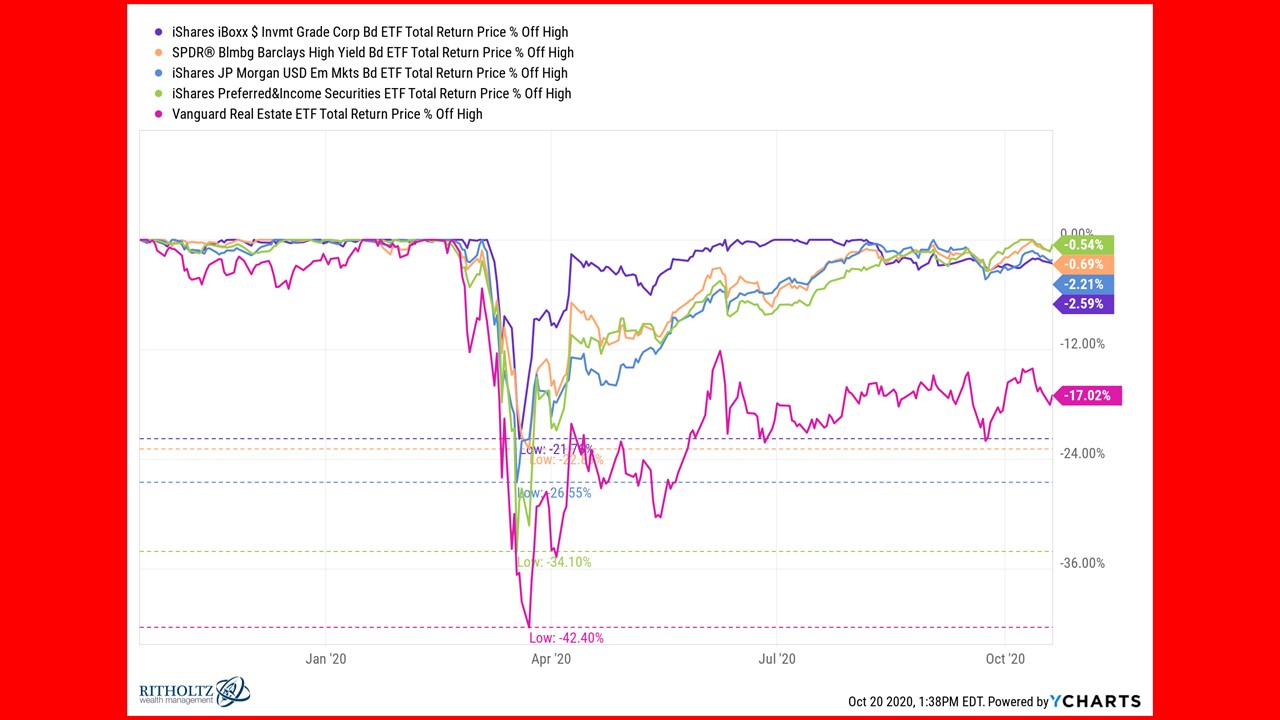
And it’s not just the stock market where investors will need to become more comfortable accepting volatility. Not only are equities subject to drawdowns, but there can be drawdowns on corporate bonds, junk bonds, emerging market bonds, preferred stocks and… even US Treasury bonds!
Yes, this is true if you’re investing in bonds as well. You may recall that I wrote about the potential perils of bonds in my “Poor Man’s Hedge Funds” blogpost too.
Check out the Bloomberg Barclays Aggregate Bond (AGG) Index. It is a good proxy for many of the total US bond market index funds, currently has a yield of only 1.2% and a duration of about 6 years. What this tells us is you could expect to earn that 1.2% annually over the next 6 years. Six more years! Come on – we can do better than that in our sleep!
The duration number also means for every 1% rise (fall) in interest rates, you should expect to see a 6% loss (gain).
These historical relationships of duration and interest rates aren’t automatic nor written in stone but it’s pretty close over long periods of time
And the longer the maturity of a bond the higher the potential volatility. For example, the iShares 20+ Year Treasury Bond ETF (TLT) currently yields around 1.3% with a duration of 19 years. That means a 1% rise (fall) in rates would lead to a 19% loss (gain).
And you thought US Treasury bonds were safe. Well, they are only “safe” at maturity when they are guaranteed to pay 100% of the investor’s principal back while paying a guaranteed interest rate/payment along the way.
So even if the long-term returns of bonds end up remaining pretty close to the current rates, the path to get there could be rocky depending on the movement of rates between now and then.
If those bond yields are too low for your liking and those potential drawdown risks are too high should interest rates rise or credit quality suffer, there are other options that pay a higher income.
My firm provided holistic portfolio construction to meet anyone’s growth and income goals. The overall portfolios can be properly built and designed for any risk tolerance. Contact me for more information.
all the best… Mark